$1.5 trillion. That is the size of the Services-as-Software market HFS Research expects by 2035.
Phil Fersht , who coined the term, describes a simple change. Enterprises stop buying effort. They stop buying headcount, day rates and static tools. They start buying outcomes that improve on their own.
That one sentence is a threat to most B2B service businesses. It is also the largest opportunity in front of them. Closing the gap between the two is a journey, not a switch, and it starts from where you stand today.
The threat is priced into your model already
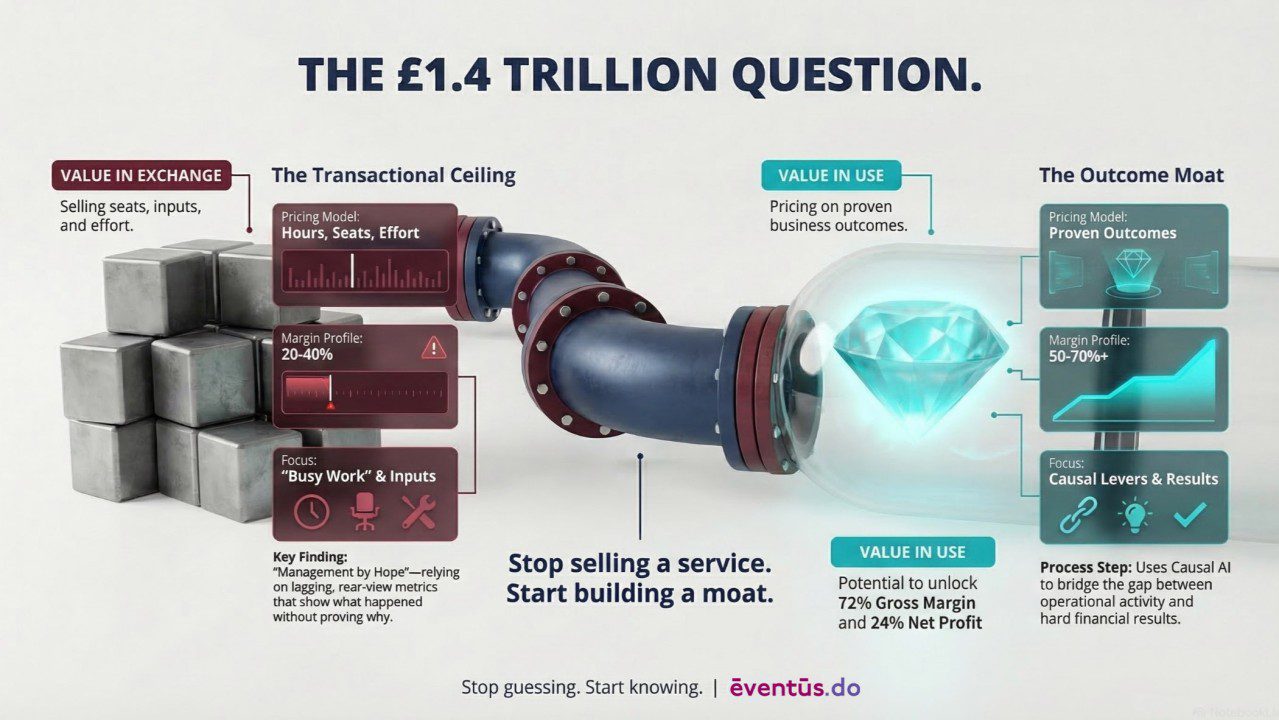
For thirty years the service business ran on a reliable trade. You sold time. The client bought effort. Everyone measured inputs, and nobody had to prove the result.
That trade is closing.
HFS expects traditional IT and people-heavy services revenue to shrink as this $1.5 trillion pool forms, with the money moving to AI-powered, outcome-driven solutions. J.P. Morgan Private Bank frames the same shift as a $3 trillion to $5 trillion opportunity created by AI-led disruption. Gartner reports that outcome-based elements are moving from the fringe to the mainstream of enterprise software buying, rising from roughly 15 percent of deals two years ago towards 40 percent.
Read that as a buyer, not a seller. Your clients are learning to pay for what they get. When that becomes the norm, a business that can only invoice for what it does is exposed. Same work. Same people. Half the pricing power.
The uncomfortable part is that the threat does not announce itself. It shows up quietly, at renewal, when a competitor puts a number on the table that you cannot match because you never measured your own.
Why moving to outcome-led is the growth story, not the defence story
Framed as defence, this looks like cost and risk. Framed correctly, it is the fastest route to revenue, margin and enterprise value from the customers you already have.
Start with revenue. Bain finds that pricing strategy and optimisation adds 2 to 8 percent to annual revenue, and that nearly all of it falls to the bottom line. Pricing tied to results captures more of the value you create. Research on outcome and usage models points to firms growing revenue around a third faster than those still selling flat subscriptions, because expansion is built into the model rather than negotiated against it.
Then margin. Bain reports that its pricing work lifts margins by around 415 basis points and pays for itself inside a year. The reason is structural. When you can attribute a client’s result to what you did, you stop discounting to win and you stop absorbing scope creep to keep the peace. You price to the value, and the value defends the price.
Then renewal. Outcome-led businesses do not chase renewals. They earn them, because the number on the invoice is already tied to a number the client cares about. Retaining a customer costs a fraction of winning a new one, and a book of business that renews itself is the quietest compounding machine a service firm owns.
Then the one that pays for everything. Enterprise value.
Buyers no longer pay premium multiples for effort. They pay for durable, expanding revenue. Net revenue retention is the clearest signal of that, and it moves the number more than almost anything else. Businesses that expand existing accounts past 120 percent net revenue retention command far higher valuation multiples than peers at 100 percent, on identical revenue and growth. Each ten points of retention above 100 percent adds to the multiple, not just the revenue. Intercom is a public example, lifting net revenue retention from 112 percent to 146 percent as it moved to outcome-linked pricing.
This is the whole argument in one line. The move from selling effort to proving outcomes changes your revenue, your margin, your renewals and your multiple at the same time, from the contract base you already hold.
A handful of numbers worth quoting
$1.5 trillion. The Services-as-Software market HFS Research expects by 2035, drawn from traditional services and software revenue.
$3 to $5 trillion. J.P. Morgan Private Bank’s sizing of the AI-led disruption opportunity across services.
2 to 8 percent. The annual revenue Bain attributes to pricing strategy and optimisation, almost all of it profit.
415 basis points. The margin uplift Bain reports from pricing work, paying for itself within a year.
25 percent. The share of created value that outcome pricing can capture, against roughly 5 percent under traditional models.
30 to 50 percent. The valuation premium carried by businesses above 120 percent net revenue retention, versus peers at 100 percent.
144 percent. The gross profit increase on a single eventus.do client contract once the outcome was baselined and priced to, with margin moving from 30 percent to 46 percent.
These are the reference points. The question is whether they describe your business yet.
Where are you in your own thinking?
Not the market’s thinking. Yours.
Have you worked out how this shift applies to your business specifically, in your sector, on your contracts, rather than as a trend you read about? Most leaders agree with the direction and have never mapped it to their own book.
Have you looked hard at the incremental revenue and margin sitting inside your existing contract base, waiting for someone to prove the outcome and price to it? For most service firms the largest growth opportunity is not new logos. It is the value they already create and cannot yet evidence.
Have you thought about the moat this builds? A business that can attribute results to its own work, and price on that basis, owns something a competitor cannot copy with a lower day rate. The proof is the wedge. The whole business aligned to the outcome is the moat.
Roughly three in four companies cannot yet attribute which of their actions drove a customer’s result. The one in four that can are pulling away, and the gap compounds every quarter.
This is a journey, not a switch
No one moves from selling effort to proving outcomes overnight. It runs in stages.
TSIA's Thomas Lah and J.B. Wood mapped it in B4B, four levels running from selling a product the customer has to turn into value alone, up to a supplier paid for the outcome it delivers.
What has changed since is that AI has put the top level within reach of ordinary service firms, not just the largest technology companies.
You baseline what your work actually drives today, using your own contract data, not a survey. You define the interventions that move the number.
You quantify the improvement you expect before you commit to it. Then you monitor and optimise, so the result compounds instead of fading.
Each stage stands on its own and pays its own way. You are never asked to bet the business on a leap. The line of sight runs from your baseline today to the value you realise, one stage at a time.
Find out where you stand
We built a short assessment to answer exactly these questions for your business. It shows where you sit on the shift from effort to outcomes, where the untapped revenue and margin sit in your current contracts, and how far your model is from the one buyers now pay a premium for.
It takes a few minutes. It gives you a position, not a platitude. It is step one of the journey, the baseline everything else builds on.
Take the Outcome Engineering assessment here: CLICK HERE
Where do you think you would score today, and what would it be worth to close the gap?
Sources
Primary-sourced: HFS Research, Services-as-Software $1.5 trillion by 2035 (hfsresearch.com). J.P. Morgan Private Bank, $3 to $5 trillion AI-led disruption opportunity (privatebank.jpmorgan.com). Bain & Company, pricing adds 2 to 8 percent to revenue and around 415 basis points to margin (bain.com). B4B: How Technology and Big Data Are Reinventing the Customer-Supplier Relationship, J.B. Wood, Todd Hewlin and Thomas Lah, TSIA, 2013, for the four-level product-tooutcome model. ēventūs.do client contract case: 144 percent gross profit increase, margin 30 to 46 percent (internal engagement data).
Directional, secondary aggregation: Gartner outcome-based adoption trend (roughly 15 to 40 percent of deals). Net revenue retention valuation premiums (120 percent NRR carrying 30 to 50 percent higher multiples). Intercom NRR 112 to 146 percent. Value-capture 25 percent versus 5 percent. These are widely reported and used here as directional, not primary, figures.